Practicing RDS data collection requires close monitoring of incoming data. Because of the absence of explicit sample design, one critical part of practicing RDS is setting certain production goals (e.g., 80 respondents by Week 3; 50% female; 30% coupon redemption) and monitoring how the data collection is progressing against the goals. The Respondent Driven Sampling Data Collection Monitoring Dashboard facilitates these tasks with graphical displays of incoming data. As a standalone application, users will be able to upload their incoming data to the system and follow simple and intuitive point-and-click instructions to generate visualizations such as the ones shown below. The system also allows users to download the graphics.
There are four types of plot that can be generated by the dashboard:
Suggested Citation
Lee, S., Yang, S., Tran, T., and Rabine, S. (2024). Respondent Driven Sampling Data Collection Monitoring Dashboard. Ver 1. https://rdstools.isr.umich.edu/monitoring-dashboard/.
Example Plots
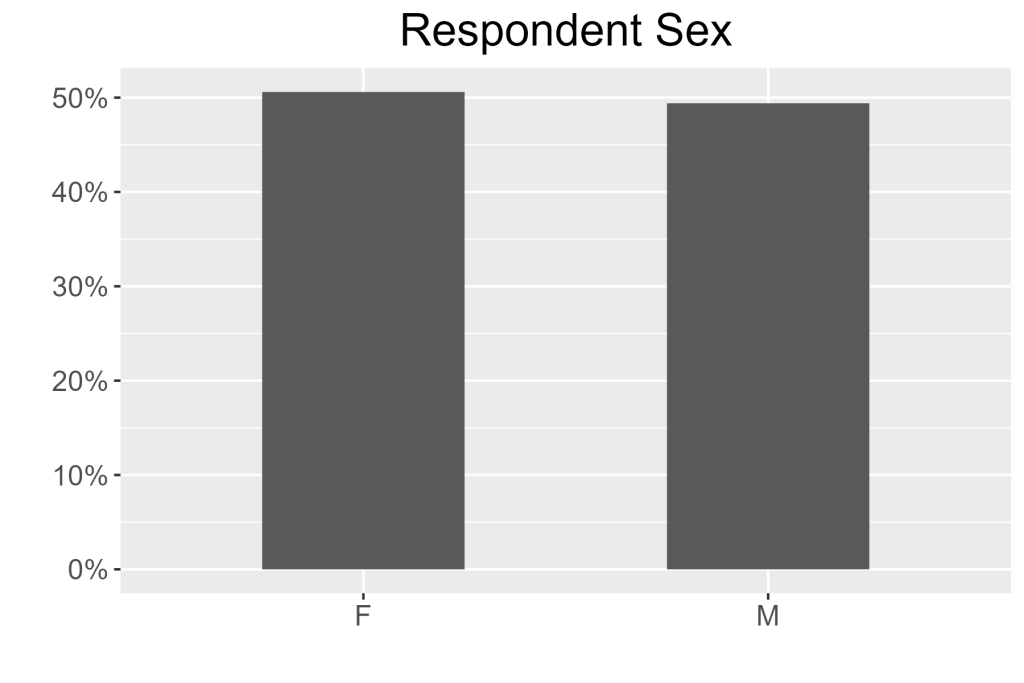
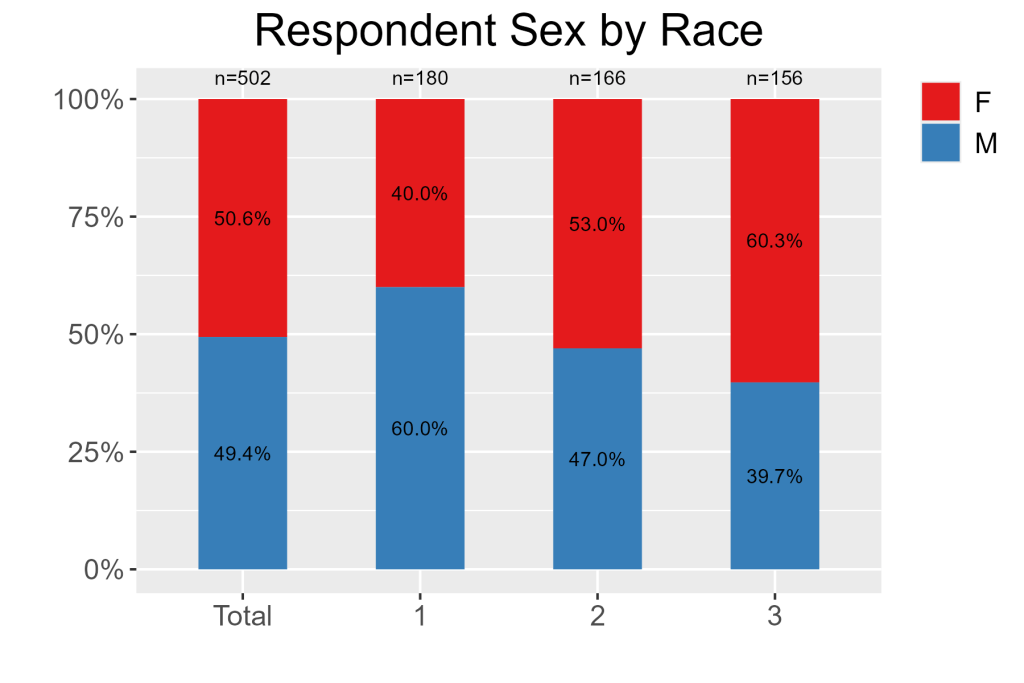
Participant characteristic plots allow for monitoring of demographic variables in the sample. Univariate plots can be created to show the distribution of a single categorical variable across the sample. Bivariate plots can be created to show the distribution of a categorical variable across levels of a second categorical variable.
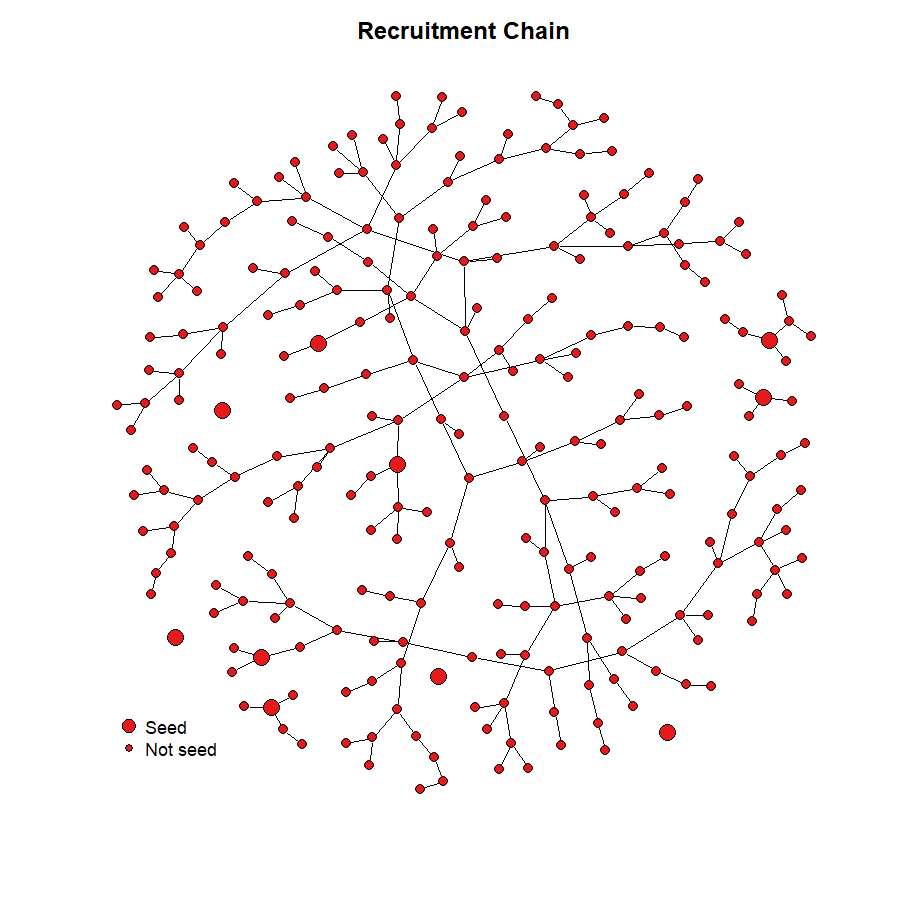
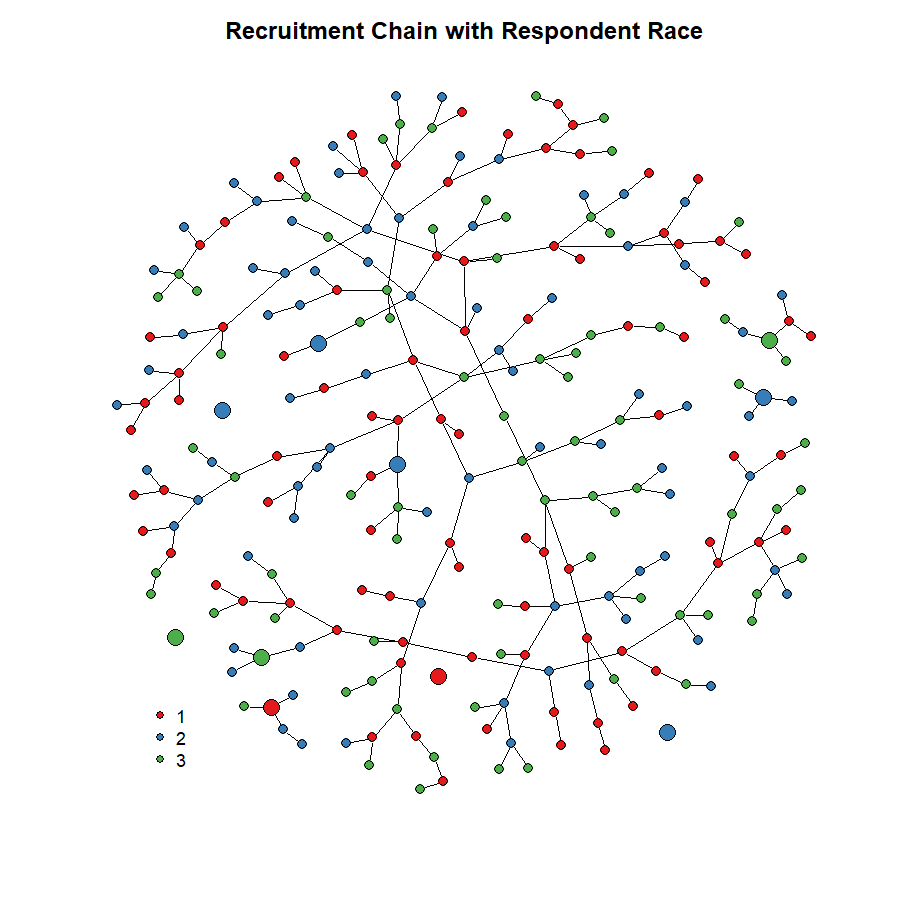
Recruitment chain plots can be used to show the recruitment connections within the sample. The basic plot shows seeds (usually those initially recruited by the researcher) and non-seeds (those recruited by others in the study). A secondary categorical variable can be added to show levels of the variable across the recruitment chain.
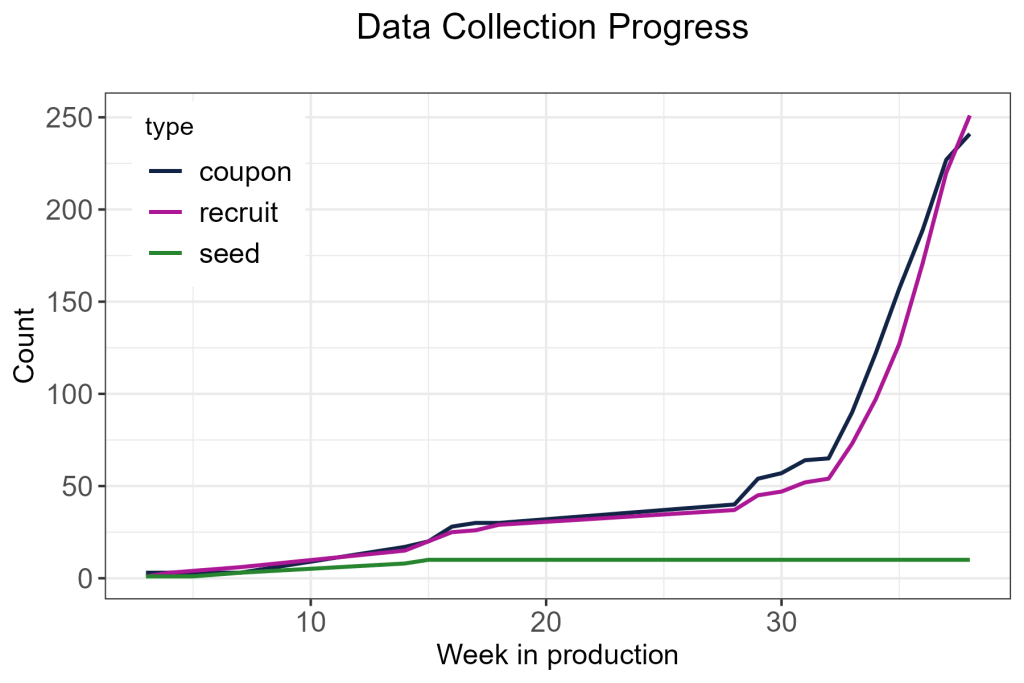
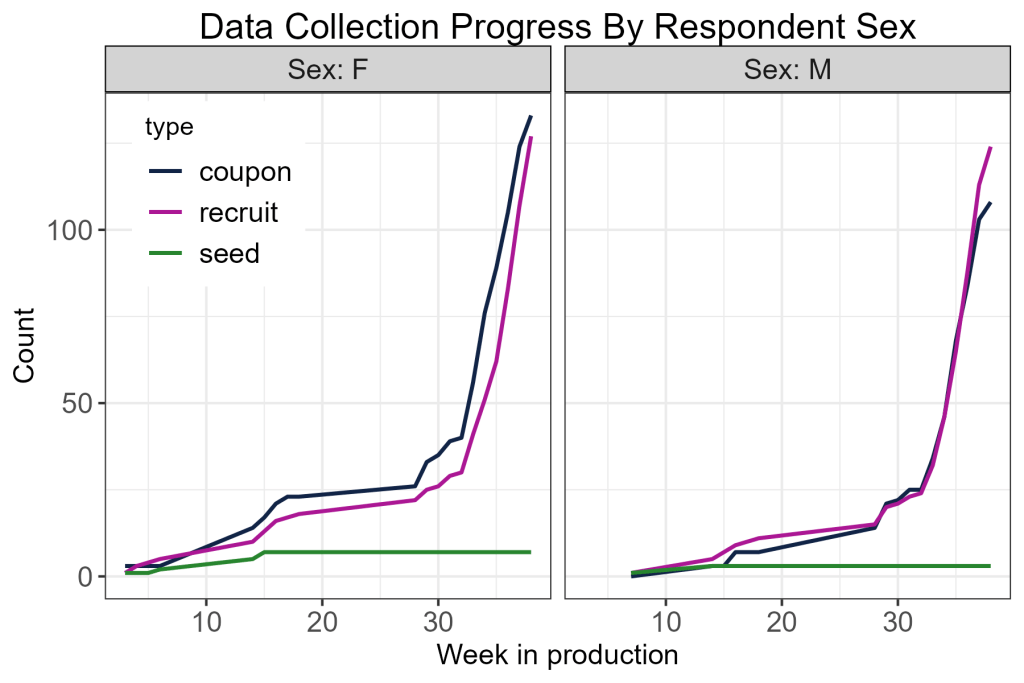
Data collection progress plots show the number of participants who were recruited or participated over time. The base plot shows this for the full sample. A secondary categorical variable can be included to show separate plots for participants with each level of the variable.
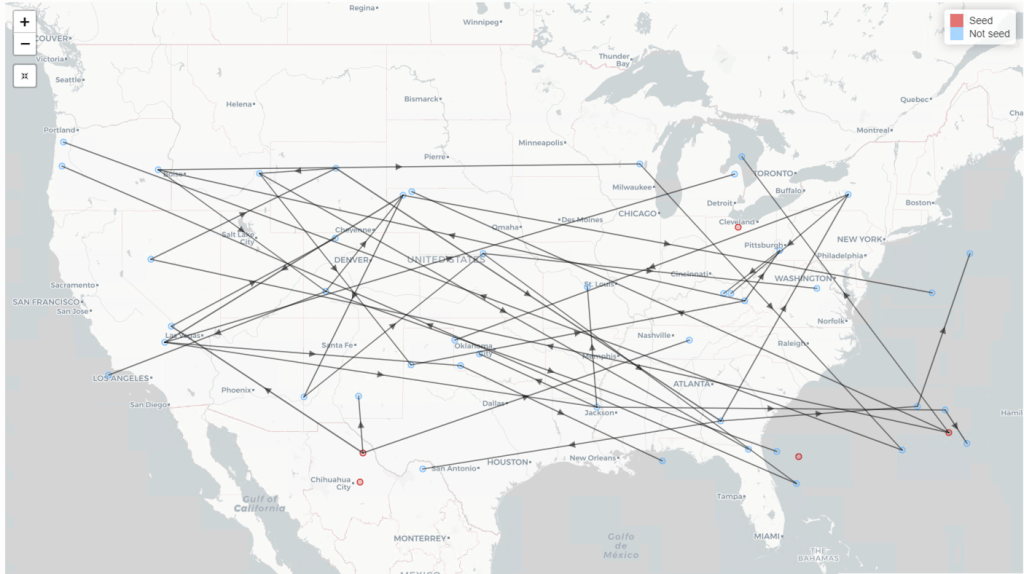
Participant mapping plots show the location of participants and the recruitment chains. The plot can be filtered to show each seed and their recruits separately and to show each wave of the recruitment incrementally.